Lack of a centralized and user-friendly platform for access to open data on Ukrainian and British companies hinders data-driven decision making for purchase and sales departments.
Solution:
A comprehensive database of open data on Ukrainian and British companies was created through user-centered design methods, with features such as clear organization, intuitive user interface, data security, custom filters, analytics, report generation, and monitoring of new companies. The design was validated through usability testing, A/B testing, and stakeholder feedback. The project was managed using Figma with clear hierarchy, naming conventions, version control, and use of symbols and styles.
To understand the market and competition in order to make informed business decisions.
Solution:
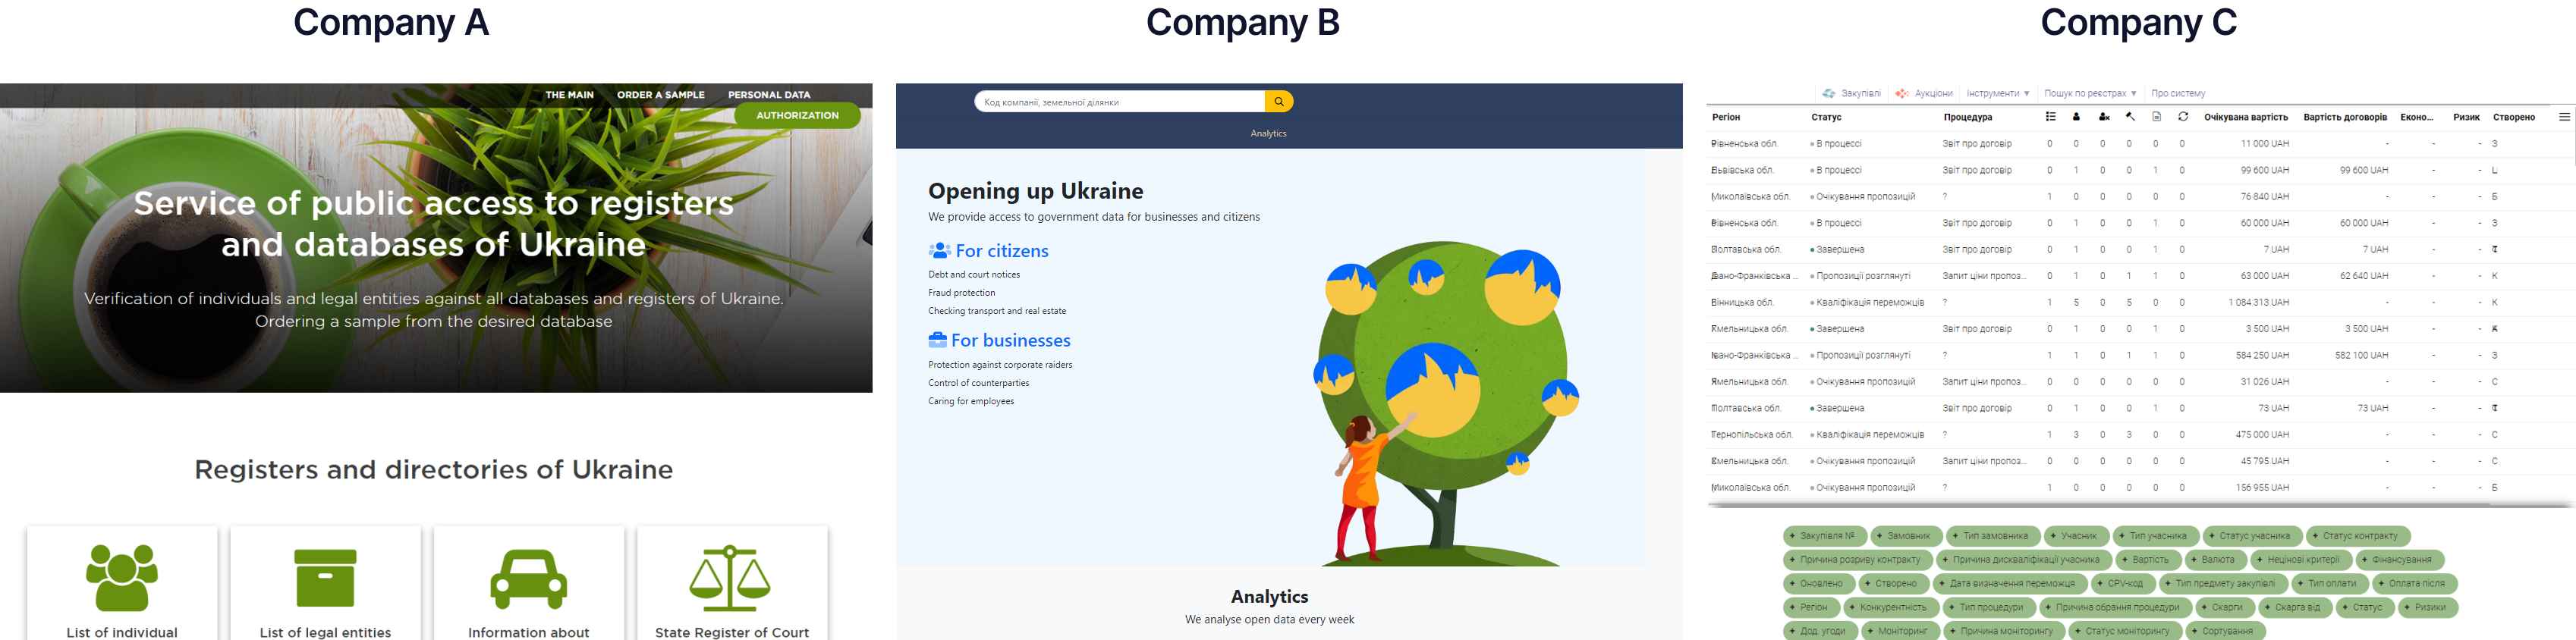
Conducting a competitive analysis helped identify strengths and weaknesses of competitors, understand market trends, and determine unique selling points to differentiate from the competition.
"Company A" offers a limited selection of data on Ukrainian companies but has a clunky user interface and outdated information.
"Company B" has a larger selection of data on Ukrainian companies but lacks information on British companies and has a costly subscription model.
"Company C" offers a range of data on both Ukrainian and British companies but the information is not easily searchable and lacks a monitoring function for new companies.
Problem:
Lack of understanding about users' needs and preferences.
Solution:
User Interviews were conducted to gather insights and information directly from the target audience, which helped to better understand their needs, preferences and behaviors, and inform product design and development decisions.
Users emphasized the need for a centralized and easily accessible source of data on Ukrainian and British companies.
Users also expressed frustration with the lack of a monitoring function for new companies and the difficulty in finding specific information such as company classification and financial indicators.
Problem:
Lack of understanding of target user's needs, behaviors, and goals.
Solution
User Personas were created to provide a comprehensive, fictional representation of the target users based on research and data collected through user interviews and surveys. This allowed the team to have a more thorough understanding of the users, their motivations, and how they interact with the product, which informed product design and development decisions.
Design Challenges:
Data organization: The database needed to be organized in a logical and intuitive way, so that users can easily find the information they need.
User experience: The database needed to be easy to use and navigate, with a clear and intuitive user interface.
Data security: The database needed to be secure, with appropriate measures in place to protect the data from unauthorized access.
Visual Branding:
Clean and minimalistic design that emphasizes the platform's focus on providing relevant data.
1. Data organization: The database was organized into clear categories and subcategories, with filters and search functionality to allow users to easily find the information they need:
2. User experience: The user interface was designed to be intuitive and easy to use, with clear navigation and a simple layout:
3. Data security: The database was protected with secure login and access controls, as well as regular security updates to ensure the data is protected from unauthorized access:
More UI examples:
For this project, we focused on creating a design system that would ensure a consistent and cohesive user experience across all platforms. This involved establishing a set of design guidelines and components that could be reused and scaled throughout the product:
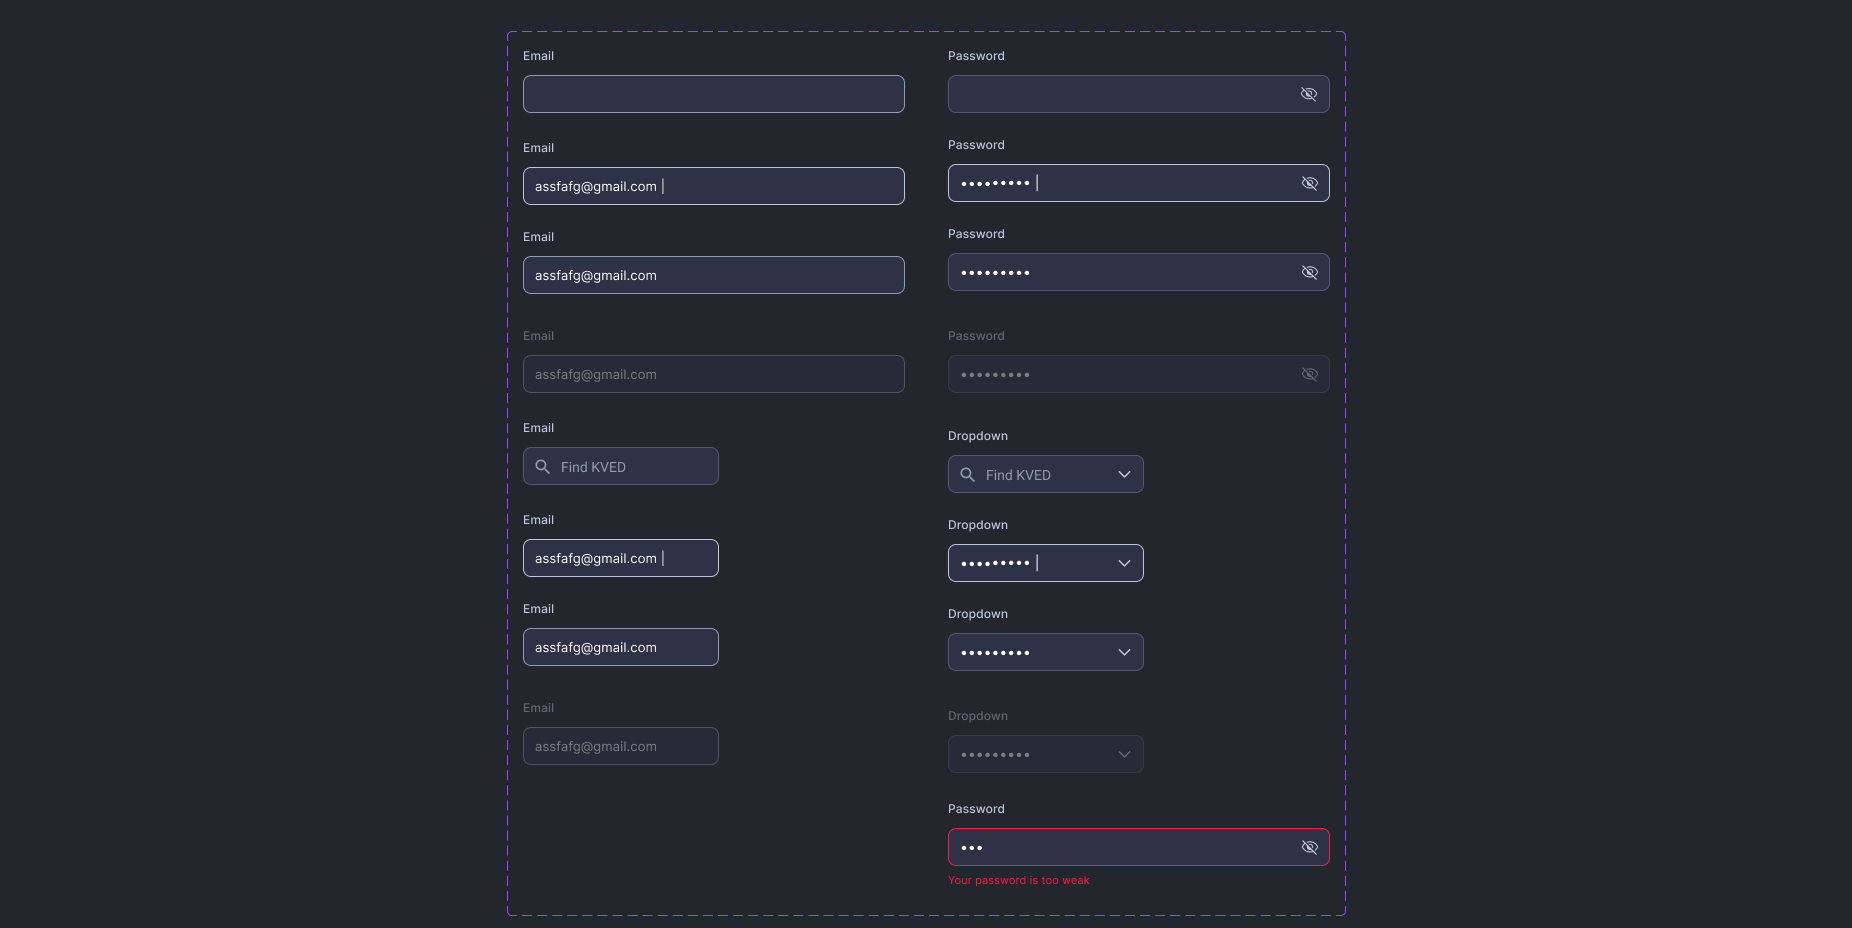
We also developed a set of UI components, such as buttons, forms, and navigation elements, that could be easily implemented and customized to fit the needs of different screens and features. This helped to streamline the design process and save time in the long run:
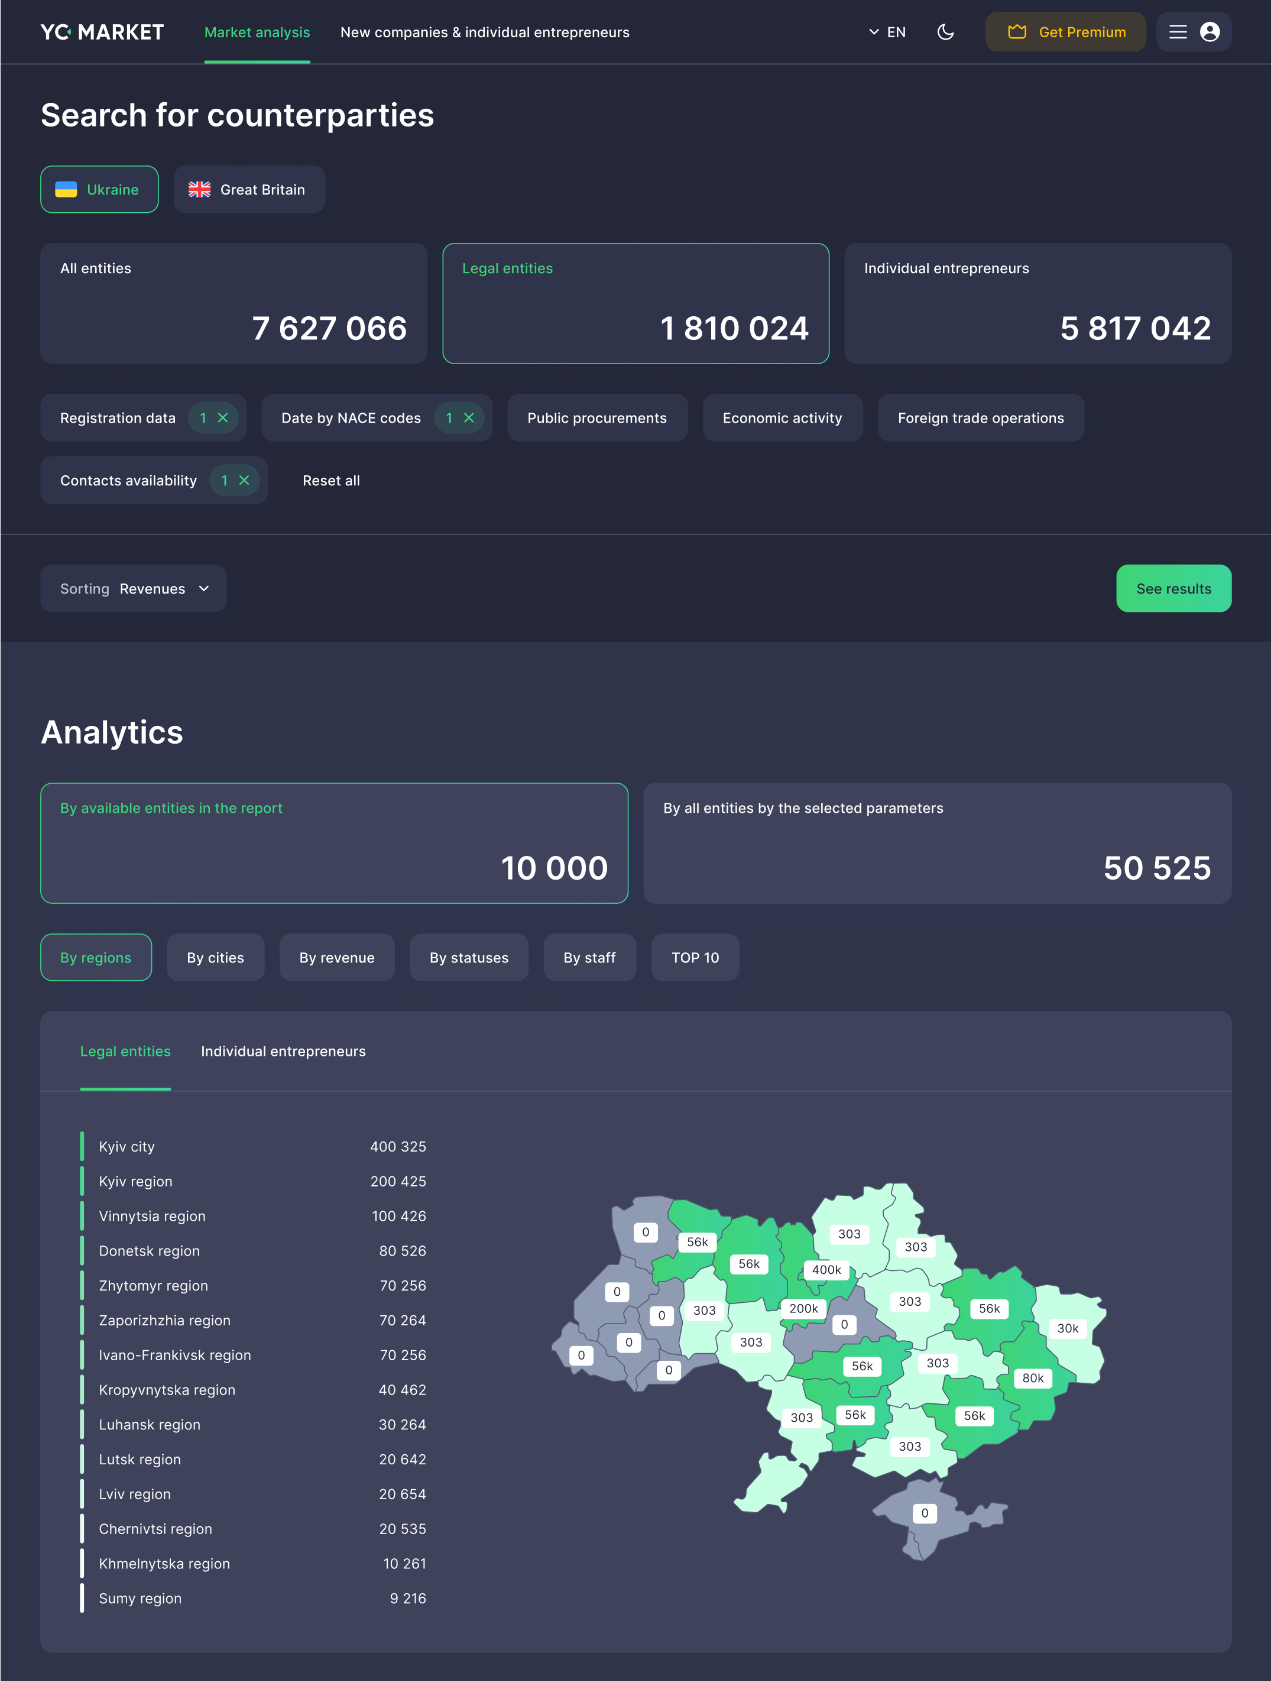
One key feature of the design was the ability to customize filters to choose specific criteria for analyzing companies, such as Classification of types of economic activity (KVED), FEA, company status, amount of revenue, region, number of employees, and volume of imports or exports. This allowed users to quickly and easily narrow down their search to the specific data points they needed:
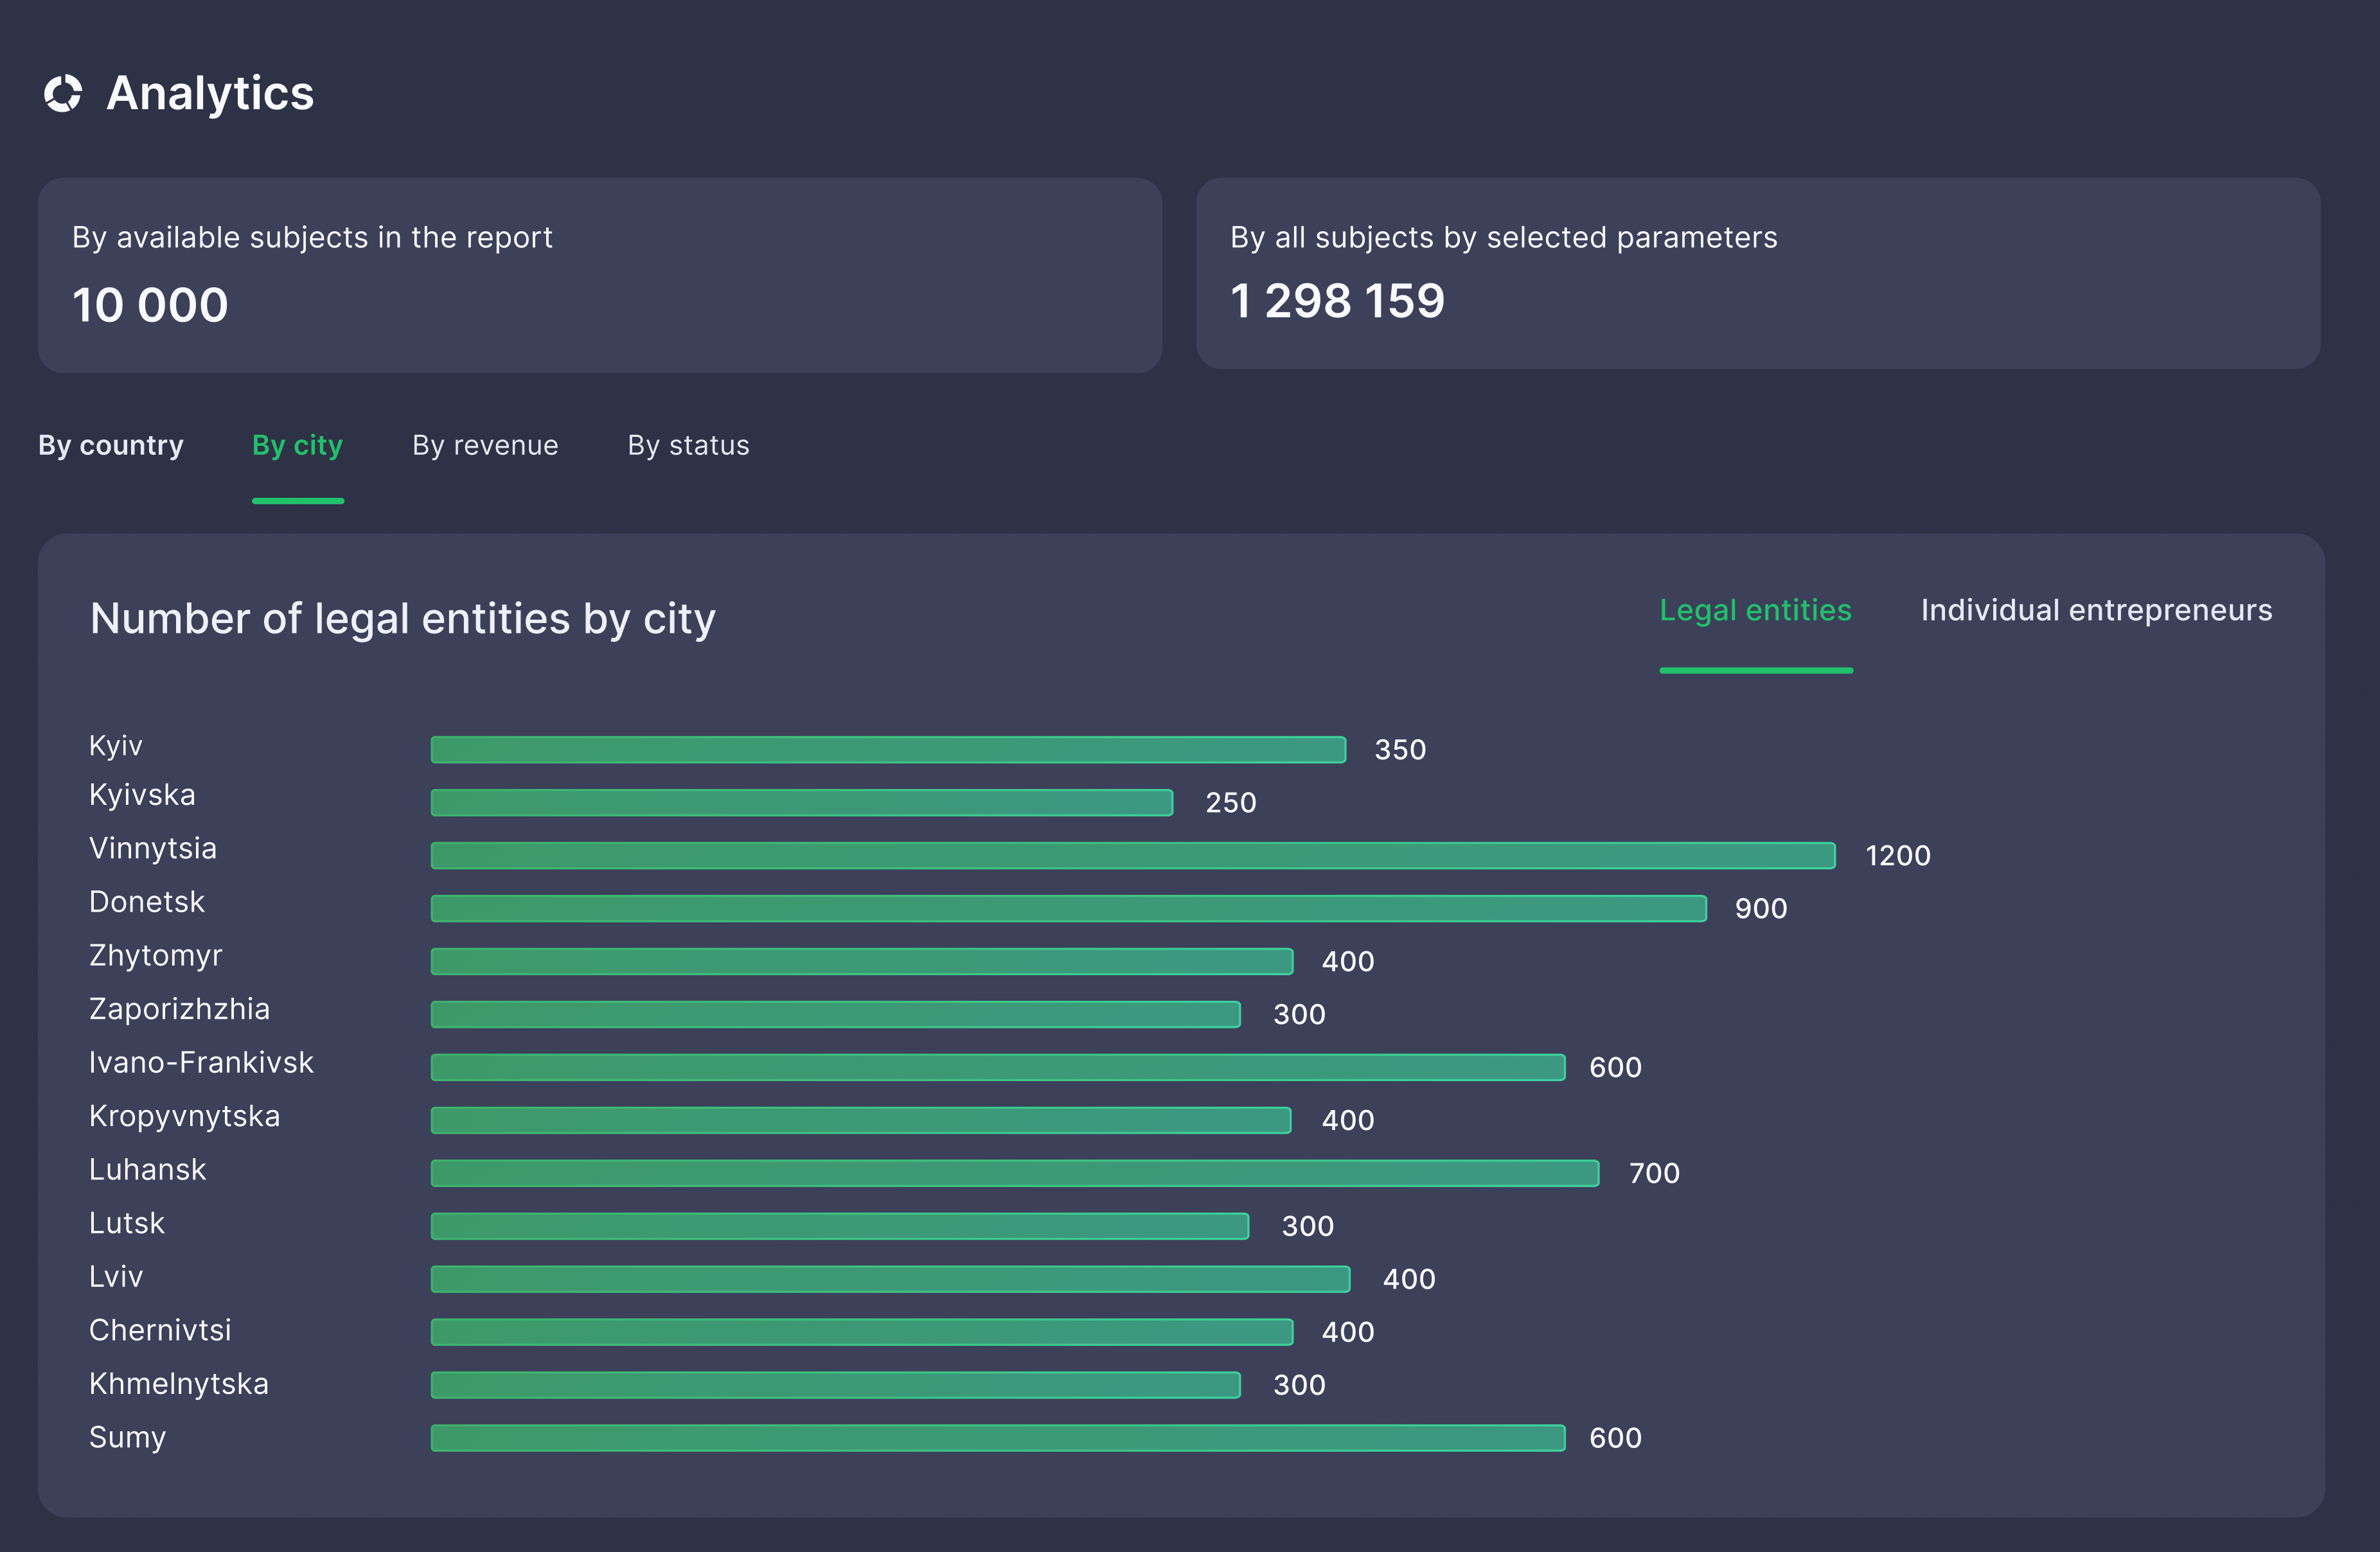
In the Analytics tab, users were able to see an analytical report in charts and quickly evaluate their selected market segment. This helped users make informed decisions about which regions and cities were most suitable for their business:
The design also included the ability to generate and download reports, allowing users to easily work with the data and find new customers and partners. Additionally, the feature to monitor new companies and individual entrepreneurs allowed users to stay up-to-date with the latest developments in the market.
Validating design techniques:
Usability testing, in which we invited a small group of users to interact with our prototypes and provided them with specific tasks to complete. This allowed us to observe their behavior and gather feedback on the ease of use and overall effectiveness of the designs.
We also conducted A/B testing, in which we presented different versions of a design element to different groups of users and compared the results. This helped us to identify which design options were the most successful in achieving our desired goals.
We also solicited feedback from stakeholders and subject matter experts, who provided valuable insights and recommendations for improvement.
Usability Testing Results
10 user interviews revealed that the platform's search function and data filters were intuitive and effective in finding specific information.
Recommended actions include further refining the monitoring function and adding more detailed information on companies.